
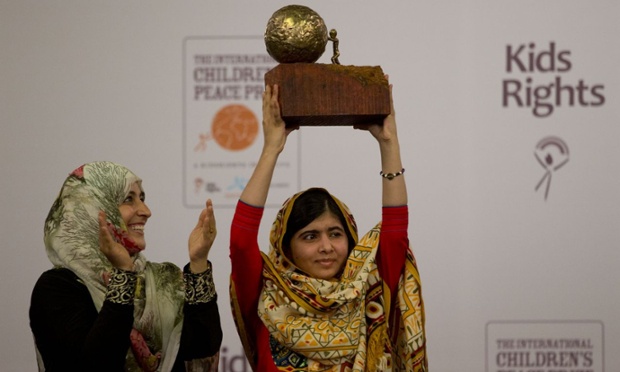
Malala Yousafzai is awarded the International Children’s Peace Prize 2013 by 2011 Nobel Peace Prize winner Tawakkol Karman of Yemen. Photograph: Peter Dejong/AP
In the struggle towards securing Women’s rights and gender equality, the term progress is often strewn throughout the pages of articles and media sites, with no real evidence or data. How do we define real, quantifiable progress in an area that is complex in nature, and means something different to women worldwide? To Malala Yousafzai in Pakistan, gender equality means the equal access to education. To the thousands of women in Darfur, who are raped as a method of warfare, gender equality means the right to decide what happens to their body. To Patricia Arquette in Hollywood, gender equality means the equal payment of men and women, and the eradication of the glass ceiling. Although difficult, this article will examine the global trends of gender inequality from 1990-2010 by evaluating three key indicators as defined by Shawn Dorius and Glenn Firebaugh: education, political participation, and economic activity[i]. Moreover, these indicators will be applied to five countries- the United States, China, Pakistan, Mexico, and Nigeria- in an effort to represent countries with the largest populations, and countries that are representative of various religions and cultures.
In the realm of education, The World Bank and UNESCO have compiled data describing the ratio of girls to boys that are enrolled in primary and secondary education. This set of numerical data highlights the level of education participation in all five countries in both public and private schools. When evaluated, a country with a score of 100 denotes equal enrollment between boys and girls; a country with a score below 100 denotes an unequal enrollment that advantages boys, while a score above 100 signifies the opposite. In both 1990 and 2010, the United States reported a ratio of 100, signifying an equal enrollment amongst genders. In 1990, China reported a ratio of 85; however, in 2010 they bettered their ratio to an equal 100. In 1990, Pakistan reported a significantly below average ratio of 50, but greatly improved in 2010 to a ratio of 85. In Mexico, in 1990, the primary and secondary school enrollment between genders was 97, and jumped to an impressive 103 in 2010. This ratio of 103 is perhaps the most notable change, because it shows that girls went from being the most disadvantaged group, to the most advantaged group. Lastly, Nigeria increased from a ratio of 79 in 1990, to 91 in 2010. [ii]
Political participation can be categorized in a multitude of ways: number of registered voters, percentage of the population that voted in the last election, percentage of the population that holds a position in government, etc. For the purposes of this article, political participation will be defined as the proportion of seats held by women in national parliaments. Although it would be effective to evaluate the percent of franchised women in each country, the statistic being evaluated holds more weight in defining progress in gender equality, because it shows the amount of women who hold substantial political power and authority. The United States has a relatively low proportion of women who hold congressional seats. In 1990, women in congress held 7% of the seats. In 2010, the proportion increased to 17%. In China the proportion of women in the National People’s Congress has remained at 21% over the 20-year period. Pakistan’s number more than doubled from 10% in 1990, to 22% in 2010. Mexico represented a similar trend, jumping from 12% in 1990, to 26% in 2010. Finding data for Nigeria’s percentage of women in parliament in 1990 proved difficult. Although Wuraola Esan, the first woman senator in the Nigerian National Assembly, was elected in 1960, there is virtually no data about the percentage of women in the Nigerian National Assembly until 2000. Using the data we have available, we can see an increase in this trend in Nigeria from the period of 2000, where women held 3% of the seats, to 2010, where women held 7% of the seats, which is still comparatively low.[iii] While quantifiable progress is being achieved, there are still significant strides that need to be made in this area. Women make up approximately 50% of each countries population, but only account for, at most, approximately one-fourth of the parliamentary seats, signifying a gross lack of representation for women.
Economic Activity can be defined as labor force participation. Moreover, it is the percent of people who are paid employees, or who are actively looking for employment. Evaluating the percentage of women in the labor force, women who earn an income, is important because economic stability can often translate to power and independence. In the United States, 56% of women participated in the labor force in 1990. In 2010, that number slightly rose to 58%. In Mexico 34% of women reported labor participation in 1990, as compared to 44% in 2010. Nigeria saw a rise from 39% in 1990 to 48% twenty years later. Pakistan has had the most significant rise, climbing to a still low 24% in 2010 from an extremely low 13% in 1990. China, however, is the only country that saw a decrease in the percent of women in the labor force. In 1990, China boasted one of the highest rates at 73%, and dropped to 64% in 2010. Although this drop is significant, their rate is still the highest overall. [iv]
The data analyzed has shown that in the fight towards gender equality, quantifiable progress has been made. Percentages, statistics and ratios alike have shown that women have made strides in the areas of education, political participation, and economic activity. This is not to say that the fight has been won, however. In fact, the advancements made over the twenty-year period from 1990-2010 were often underwhelming, especially when looking at the amount of women who held legislative positions in government. When looked at through a qualitative lens, there may be many factors not evaluated in this essay that could potentially undermine some of the statistical progress. For example, although there are more women in the workforce, the majority of these women may work longer hours for lower wages. We have reason to be optimistic, the data is trending positively- there were times when women weren’t even allowed in school, in the government, or in offices- but we still have a ways to go. Quantifiably we are moving in the right direction, we are progressing; we still, however, must ensure that with progress comes a higher quality of life.
Works Cited:
[i] Dorius, Shawn F., and Glenn Firebaugh. “Trends in global gender inequality.” Social Forces 88.5 (2010): 1941-1968.
[ii] World Development Indicators. N.p.: n.p., n.d. Ratio of girls to boys in primary
and secondary education (%). The World Bank DataBank. Web. 6 Mar. 2015.
<http://databank.worldbank.org/data/views/reports/tableview.aspx>.
[iii] “Women in National Parliaments.” Inter-Parliamentary Union. N.p., n.d. Web. 6 Mar.
- <http://www.ipu.org/wmn-e/history.htm>.
[iv] ILO (2013a). [“Key Indicators on the Labour Market: 7th edition”. Geneva: ILO.].http://www.ilo.org/empelm/what/lang–en/WCMS_114240. Accessed December, 2013.
Leave a Reply
You must be logged in to post a comment.